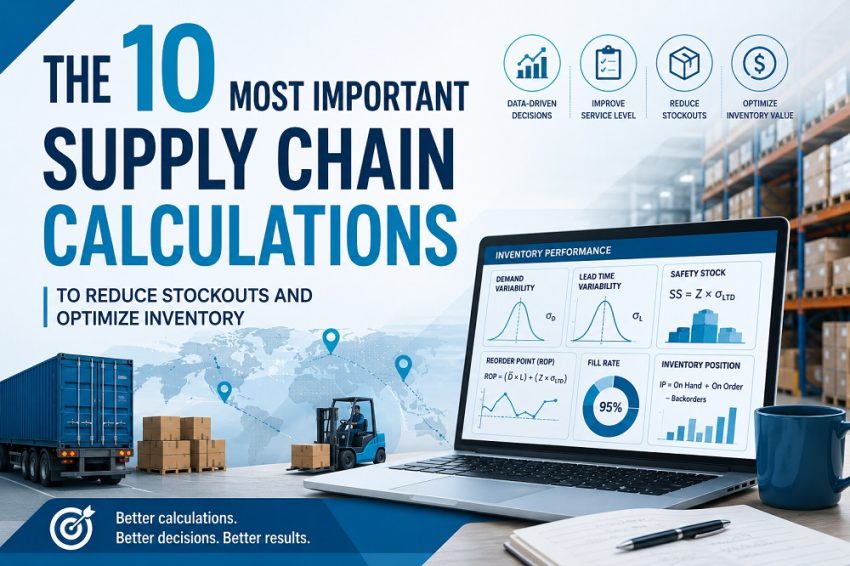
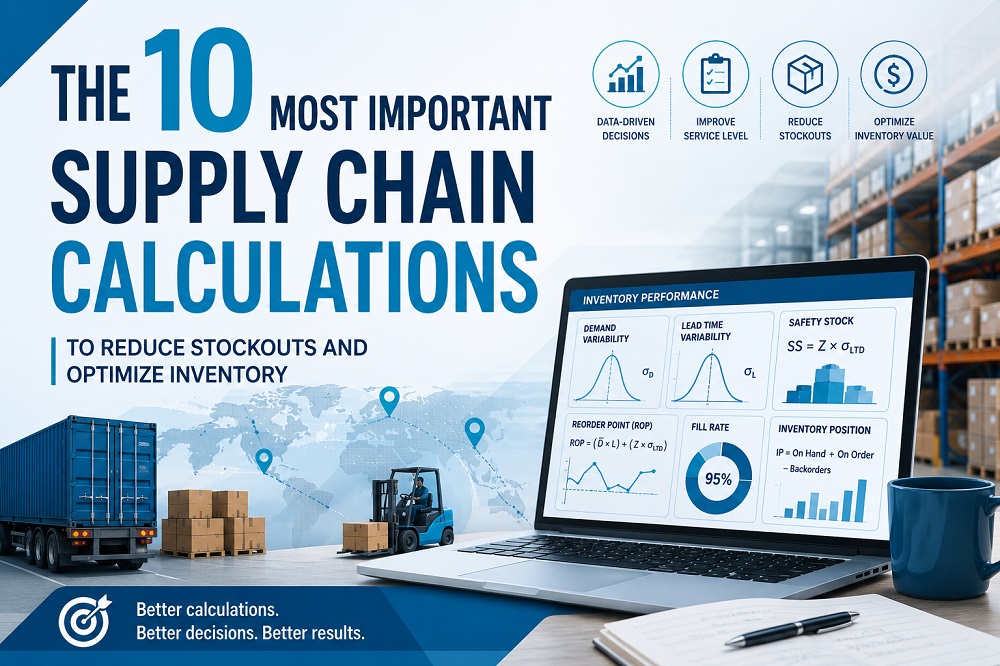
The 10 most important supply chain calculations to reduce stockouts are: reorder point, safety stock, economic order quantity (EOQ), days of supply, inventory turnover, fill rate, lead time demand, ABC analysis, carrying cost, and demand forecast accuracy. Together, these formulas give you full control over how much stock you hold, when to reorder, and how much buffer you need to handle uncertainty.
If your warehouse is constantly running out of fast-moving items or tying up too much cash in slow-moving stock, the numbers are telling you something. The problem is not usually bad luck or an unreliable supplier. Most of the time, it is a missing formula or one that has not been updated in months.
This guide walks through each calculation clearly, explains why it matters, and shows you how to apply it in a real warehouse or distribution setting.
1. What Is the Reorder Point and How Do You Calculate It?
The reorder point (ROP) tells you exactly when to place a new purchase order so stock arrives before you run out. It is one of the most practical calculations in inventory management.
Formula
ROP = (Average Daily Sales x Lead Time in Days) + Safety Stock
Real-World Example
A health supplement brand sells 40 units per day of its bestselling protein powder. The supplier takes 7 days to deliver. The business keeps 100 units as safety stock.
- Average daily sales: 40 units
- Lead time: 7 days
- Safety stock: 100 units
- ROP = (40 x 7) + 100 = 380 units
When stock drops to 380 units, it is time to reorder. Without this number, teams often reorder too late and end up apologizing to customers.
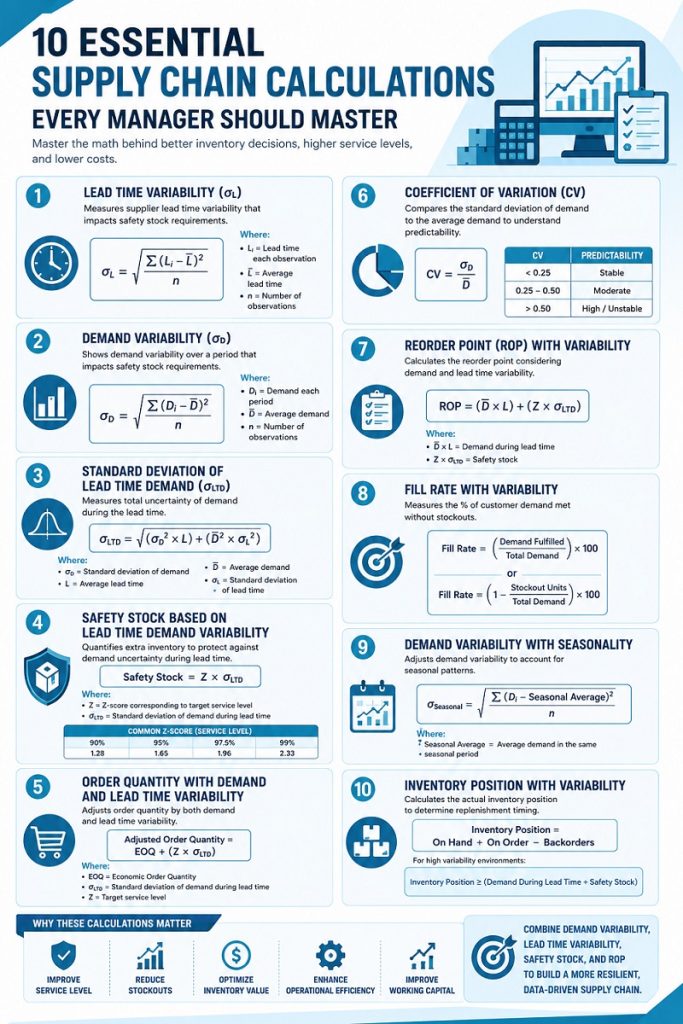
2. How Do You Calculate Safety Stock to Prevent Stockouts?
Safety stock is a buffer you keep on hand to absorb unexpected spikes in demand or delays from suppliers. Getting this number right is the difference between a smooth operation and a chaotic one.
Formula (Standard Method)
Safety Stock = Z x Standard Deviation of Lead Time Demand
Z is the service level factor. For 95% service level, Z equals 1.65. For 99%, Z equals 2.33.
Simpler Formula for Small Businesses
Safety Stock = (Max Daily Sales – Average Daily Sales) x Max Lead Time
Real-World Example
A fashion retailer sells an average of 20 T-shirts per day but has hit a peak of 35 on busy weekends. The supplier lead time is 10 days.
- Safety stock = (35 – 20) x 10 = 150 units
That 150-unit buffer protects against weekend surges and late deliveries.
3. What Is Economic Order Quantity and Why Does It Save Money?
Economic Order Quantity (EOQ) finds the ideal order size that minimizes the total cost of ordering and holding inventory. Order too little and you pay more in frequent shipping fees. Order too much and your storage costs eat into your margins.
Formula
EOQ = Square Root of [(2 x Annual Demand x Ordering Cost) / Holding Cost per Unit]
Real-World Example
An e-commerce store sells 6,000 units of a kitchen gadget per year. Each order costs Rp 500,000 to process. Holding one unit per year costs Rp 10,000.
- EOQ = Square root of [(2 x 6,000 x 500,000) / 10,000]
- EOQ = Square root of 600,000,000
- EOQ = approximately 775 units per order
Ordering in batches of 775 units balances shipping costs against storage costs and avoids both extremes.
4. How Do You Calculate Days of Supply to Know How Long Stock Will Last?
Days of supply (DOS) tells you how many days your current inventory will last at the current rate of demand. It is a fast reality check before a stockout hits.
Formula
Days of Supply = Current Inventory on Hand / Average Daily Demand
Real-World Example
A baby product brand has 2,400 diapers in stock. It sells 120 packs per day.
- Days of supply = 2,400 / 120 = 20 days
If the supplier needs 15 days to restock, the team has 5 days of cushion. If the lead time is 25 days, they are already late. This single number triggers the right conversation at the right time.
5. What Is Inventory Turnover and What Does a Good Ratio Look Like?
Inventory turnover measures how many times you sell and replace your stock within a given period. A higher ratio usually means healthy sales and lean inventory. A lower ratio can mean dead stock or over-purchasing.
Formula
Inventory Turnover = Cost of Goods Sold / Average Inventory Value
Real-World Example
A grocery distributor has Rp 1.2 billion in COGS for the year. Its average inventory value is Rp 300 million.
- Turnover = 1,200,000,000 / 300,000,000 = 4
A turnover of 4 means it cycled through its entire inventory 4 times in a year. For grocery, this is on the low side. For heavy machinery, it might be fine. Always compare against your industry benchmark.
6. How Is Fill Rate Calculated and Why Does It Reflect Customer Satisfaction?
Fill rate measures the percentage of customer demand that you can fulfill immediately from available stock, without backorders or delays. It is a direct signal of how well your inventory planning serves your customers.
Formula
Fill Rate = (Orders Fulfilled on Time / Total Orders Received) x 100
Real-World Example
In one month, an electronics distributor received 1,000 orders. It shipped 940 on time without any backorders.
- Fill rate = (940 / 1,000) x 100 = 94%
A 94% fill rate sounds good, but the 6% gap represents 60 disappointed customers. For B2B distributors, a fill rate below 95% often triggers contract penalties. Tracking this monthly keeps your team focused on the right outcomes.
7. What Is Lead Time Demand and How Does It Affect Your Reorder Strategy?
Lead time demand is the total number of units you expect to sell while waiting for a new order to arrive. It is the core input for both your reorder point and safety stock calculations.
Formula
Lead Time Demand = Average Daily Demand x Lead Time in Days
Real-World Example
A snack food distributor sells 300 boxes per day of its bestselling product. The supplier takes 8 days to ship.
- Lead time demand = 300 x 8 = 2,400 boxes
This means the business needs 2,400 boxes just to cover regular sales while the next shipment is on its way. Any safety stock sits on top of this number. Many teams forget that and wonder why they keep running out even after reordering.
8. How Does ABC Analysis Help You Focus Inventory Efforts on What Matters?
ABC analysis ranks your products by their revenue contribution so you can give the most attention to the items that drive the most business value. It is not a formula in the traditional sense, but it is one of the most powerful calculations you can run on your inventory data.
How It Works
- Category A: Top 10 to 20% of SKUs that generate 70 to 80% of revenue. Monitor these tightly with frequent reorder reviews.
- Category B: Middle 30% of SKUs contributing around 15 to 20% of revenue. Review monthly.
- Category C: Bottom 50% of SKUs accounting for just 5 to 10% of revenue. Lean safety stock, less frequent reviews.
Real-World Example
A hardware store carries 500 products. After running ABC analysis, they find that just 50 SKUs (10%) generate 75% of their monthly sales. These 50 items get daily stock checks, tighter reorder points, and the most reliable supplier agreements. The remaining 450 items are managed with a lighter touch.
This simple prioritization frees up hours of team time every week without risking the products that matter most.
9. What Is Inventory Carrying Cost and How Does It Affect Your Margins?
Inventory carrying cost is the total annual expense of holding one unit of stock in your warehouse. It includes storage fees, insurance, spoilage risk, capital tied up in the goods, and the opportunity cost of that money not being used elsewhere.
Formula
Carrying Cost % = (Total Holding Costs / Average Inventory Value) x 100
Real-World Example
A cosmetics importer holds an average inventory worth Rp 500 million. Its annual holding costs (warehouse rent, insurance, obsolescence, financing) total Rp 100 million.
- Carrying cost = (100,000,000 / 500,000,000) x 100 = 20%
That means every unit sitting unsold is costing the business 20% of its value per year. A product worth Rp 50,000 costs Rp 10,000 just to keep on the shelf annually. This is why overstocking is never free, and why EOQ and inventory turnover calculations work hand in hand with this one.
10. How Do You Measure Demand Forecast Accuracy and Why Does It Matter?
Demand forecast accuracy tells you how close your sales predictions were to actual demand. If your forecasts are consistently off, every downstream calculation, from safety stock to EOQ to reorder points, will be off too.
Formula (Mean Absolute Percentage Error)
MAPE = (Sum of |Actual – Forecast| / Actual) / Number of Periods x 100
Real-World Example
A toy distributor forecasted sales of 500 units in October. Actual sales were 620 units.
- Error = |620 – 500| / 620 = 19.4%
A MAPE below 10% is considered good for most consumer goods. If your error is consistently above 20%, your safety stock calculations will never be accurate enough to prevent stockouts or avoid excess inventory. Improving forecast accuracy is often the highest-leverage action in any inventory optimization project.
How Do These 10 Calculations Work Together in Practice?
None of these formulas works in isolation. They form a system.
Start by running ABC analysis to identify which products deserve the most attention. Then calculate lead time demand and safety stock for your Category A items. Use those inputs to set your reorder points. Run EOQ to find the most cost-efficient order quantity. Track inventory turnover and days of supply weekly to catch early warning signs. Monitor fill rate to see whether your system is actually working for customers. Revisit demand forecast accuracy monthly and tighten your inputs whenever MAPE drifts upward.
The businesses that do this well are not necessarily using expensive software. Many start with a spreadsheet. What matters is consistency: the team runs these numbers regularly, reviews the results, and adjusts when reality diverges from the plan.
What Are the Most Common Mistakes When Using These Supply Chain Formulas?
- Using annual averages for daily demand calculations. Seasonal spikes are invisible in an annual average.
- Setting safety stock once and never updating it. Supplier lead times and demand patterns change.
- Ignoring carrying cost when setting stock levels. Overstocking is not free insurance.
- Applying the same reorder logic to all products. Category A items need tighter monitoring than Category C.
- Forecasting based on last year without adjusting for trends, promotions, or market shifts.
Correcting even one of these mistakes typically leads to a measurable improvement in stockout frequency and inventory value within a quarter.
Last but not least
Supply chain calculations are not just for analysts or large corporations. Whether you run a three-person import business or manage a regional distribution center, these 10 formulas give you the language to describe your inventory problems precisely and the tools to fix them systematically.
Start with the ones that match your most pressing pain point. If you are stockingout on your best sellers, begin with reorder point and safety stock. If your cash is tied up in slow movers, start with inventory turnover and carrying cost. Build from there.
The math is not complicated. What matters is that you run it consistently and let the numbers guide your decisions.
That’s all from me. I hope you find this valuable and insightful!
“Transforming Supply Chains, Empowering People, Delivering Results – Eddy Suryadi”
*Feel free to share this article with your network to help them gain valuable insights as well. For more tips and updates on supply chain management, don’t forget to connect with me on Linkedin